What is Transcriptomics?
Transcriptome analysis is the study of RNA expression and its relationship with cellular function [1]. In this case, studying gene expression in cells experiencing invasive or metastatic phenotypes characteristic of LADC, can shed light on EGFR-related gene expression. Transcriptomics experiments including RNA-seq, microarrays, qRT-PCR and single-cell RNA-seq are all high throughput technologies that give overall gene expression of various types of RNA [2].
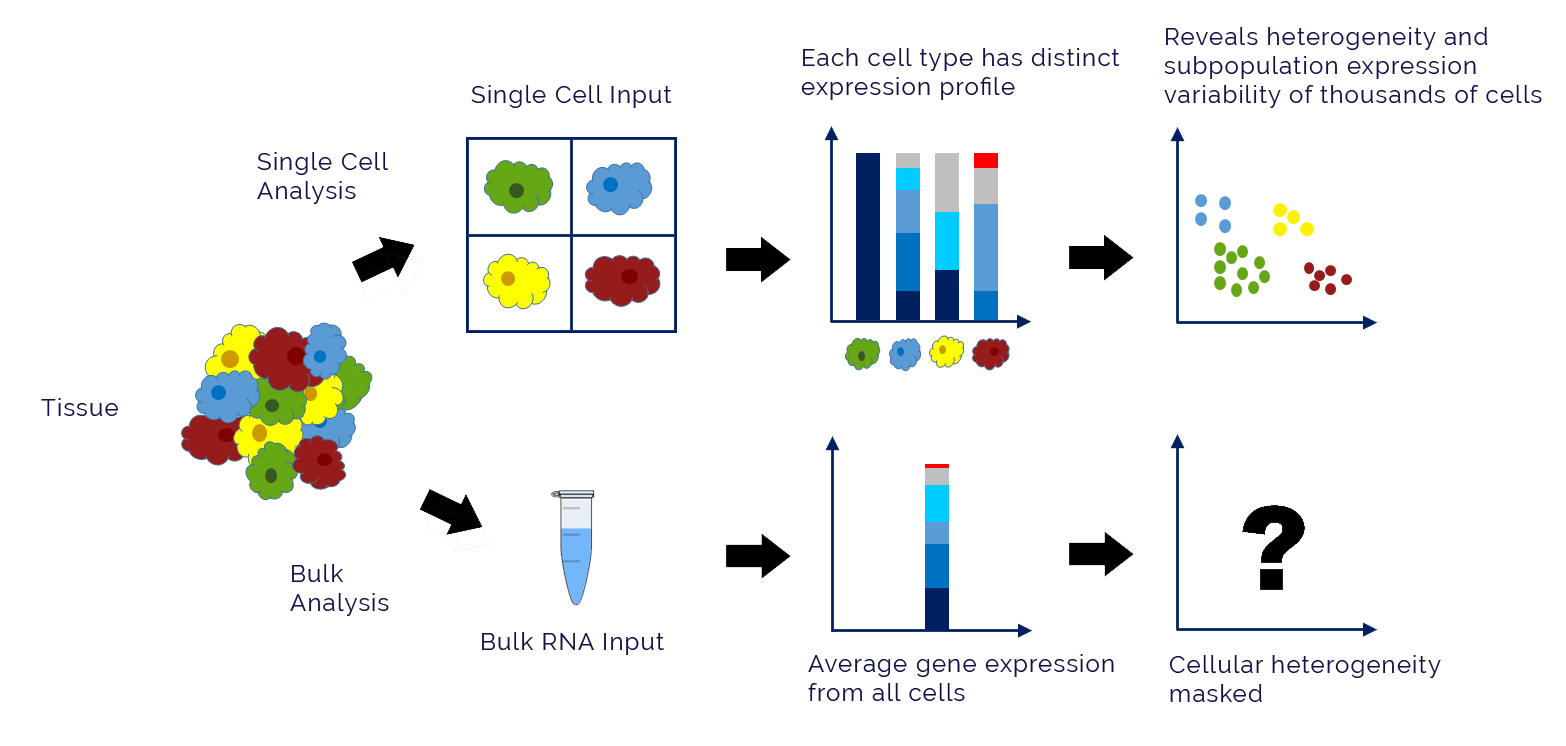
For example, the expression patterns of lncRNAs in NSCLC cells EGFR with different TKI resistance, have been analyzed in EGFR-TKIs-resistant cell lines using datasets from the Gene Expression Omnibus (GEO) database [3].How does transcriptonomics data correlate to LADC phenotypes? Can RNA expression levels give insight into transcriptional regulation by EGFR?
|
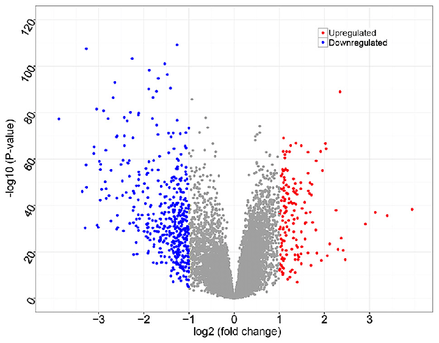
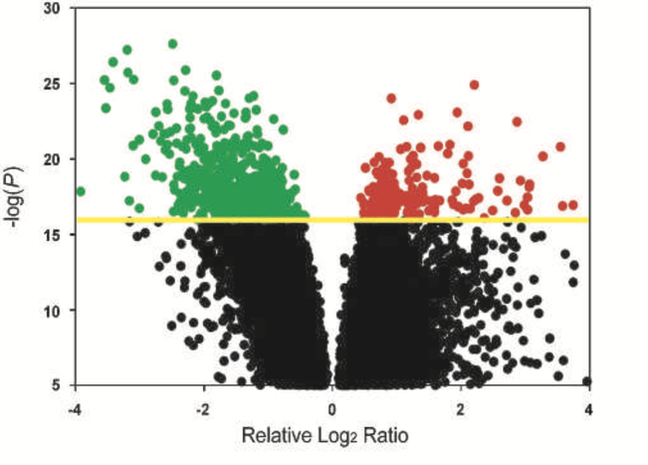
An example of how gene expression can be visualized is a volcano plot, shown on the left. The change in gene expression upon a cellular change can show what genes are necessary for biological processes and diseases. Gene expression can also be visualized by a pie chart as demonstrated in the results section or countess other ways.
|
Results
The Human Protein Atlas, an online database containing gene expression data, yielded vital information about EGFR signaling. EGFR activates downstream signaling cascades including the PI3 kinase-AKT, PLCgamma-PKC, STATs and RAS-RAF-MEK-ERK. STATs operate within the nucleus and are able to regulate transcription which is important for cellular processes in LADC [4].
|
|
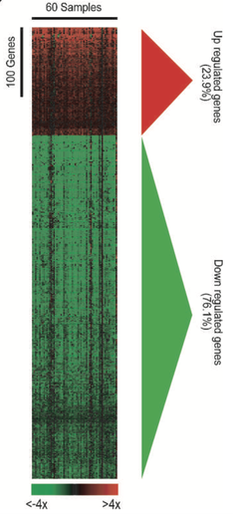
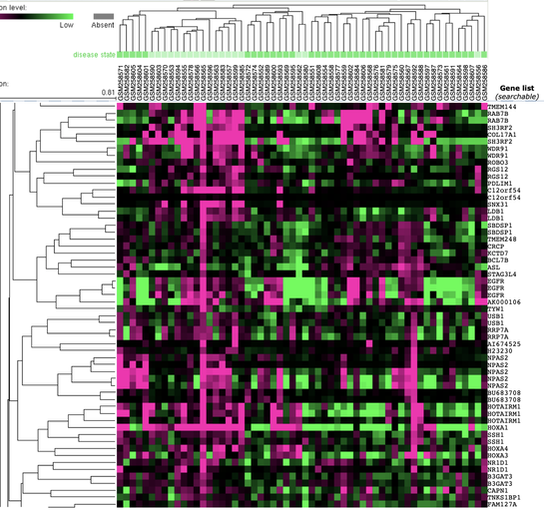
From the GEO dataset, microarray gene expression profiling represented as a cluster analysis shown above, illustrates that gene expression varies depending on TKI sensitivity gefitinib and mesenchymal phenotypes, important for LADC [3]. Specifically, the transition to a mesenchymal phenotype, is accomplished through transcriptional reprogramming by factors, like TWIST. Other research, utilizing other Transcriptonomics experiments like qRT-PCR, reveal that TWIST expression involves STAT3, whose activity depends on EGFR [4].
|
The image to the left was from the GEO dataset: "Non-small lung cancer subtypes: adenocarcinoma and squamous cell carcinoma [Homo sapiens]". From the the specific genes correspond to cancer phenotypes and expression levels indicated by the color of each array element. Interpreting these large datasets can be done by Panther analysis.
|
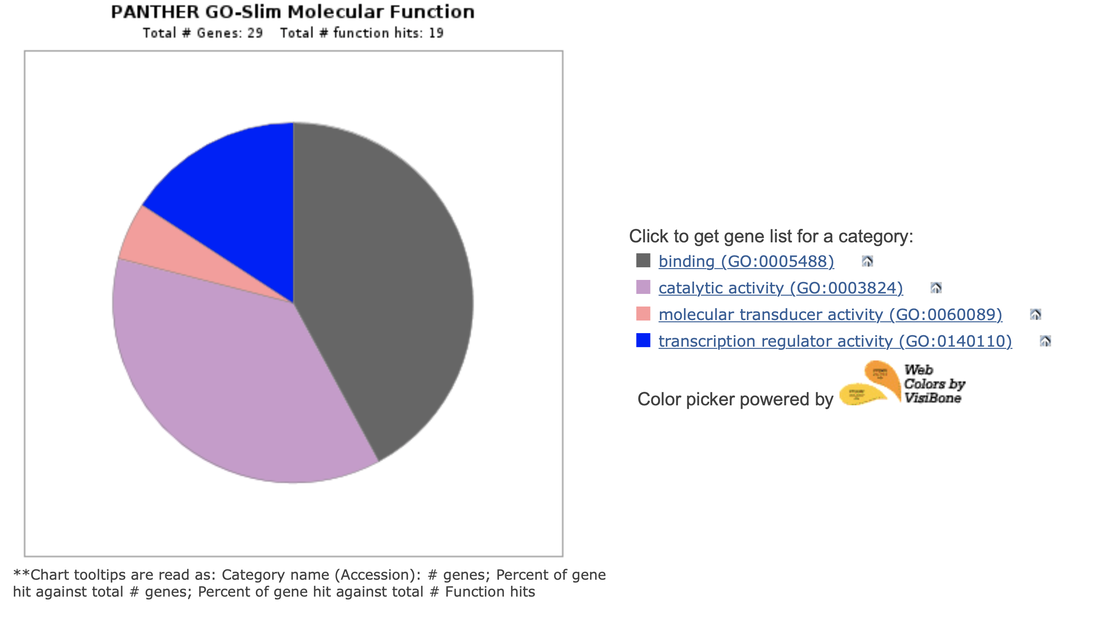
It seems like transcription regulation and catalytic activity are the main roles of EGFR in Non-Small Lung cancer associated expression. The catalytic activity of EGFR is known to be related to transcription which further implicates transcription regulation in LADC. The gene expression pattern of EGFR mutants can be visualized against a few GO terms implicated in Non-Small Lung Cancer:
Discussion
RNA profiling of cells undergoing mesenchymal transition display upregulation of TWIST and downregulation of E-Cadherin, which can shed light on the biological process underlying LADC [5]. Since TKI sensitivity is dependent on this type of cell cycle deviation, measuring expression of EGFR cascade-related proteins can yield better prognoses for this type of cancer.
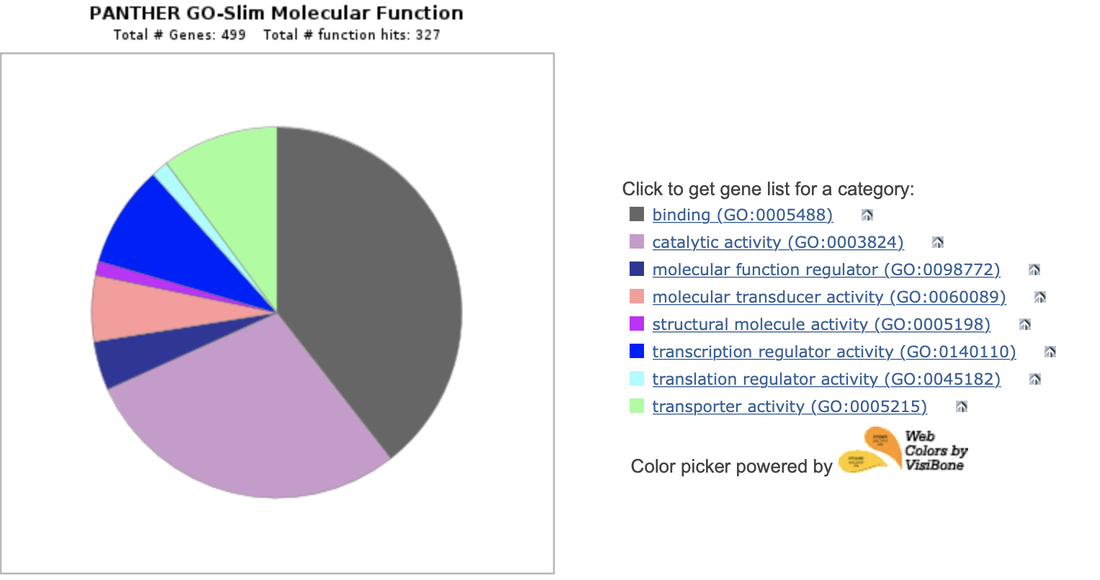
When expanding the PANTHER analysis of EGFR using a larger list of genes from the GEO dataset but for humans instead, more cellular activity is produced in the pie chart. Structural molecule activity may refer to actin regulation or cell polarity. This could contribute to cellular migration in LADC. The EGFR gene showed variable expression. The alpha isoform mRNA is shown bellow, as an example:
| mrna.fa |
References
1.) Ma, Zhang, et al., Transcriptome Analysis of EGFR Tyrosine Kinase Inhibitors Resistance Associated Long Noncoding RNA in Non-Small Cell Lung Cancer (2017). Retrieved: https://pubmed.ncbi.nlm.nih.gov/28040594-transcriptome-analysis-of-egfr-tyrosine-kinase-inhibitors-resistance-associated-long-noncoding-rna-in-non-small-cell-lung-cancer
2.) Tirosh, Izar, et al., Dissecting the multicellular ecosystem of metastatic melanoma by single-cell RNA-seq, 2016. Retrieved from: https://www.ncbi.nlm.nih.gov/pmc/articles/PMC4944528/
3.) Coldren, Helfrich, et al., Baseline Gene Expression Predicts Sensitivity to Gefitinib in Non–Small Cell Lung Cancer Cell Lines, 2006. Retrieved from: https://mcr.aacrjournals.org/content/4/8/521.long
4.) Lo, Hsu, et al., Epidermal Growth Factor Receptor Cooperates with Signal Transducer and Activator of Transcription to Induce Epithelial-Mesenchymal Transition in Cancer Cells via Up-regulation of TWIST Gene Expression, 2008. Retrieved: https://www.ncbi.nlm.nih.gov/pmc/articles/PMC2570961/
5.) Lee, Chen, Identification of a Novel Biomarker, SEMA5A, for Non-Small Cell Lung Carcinoma in Nonsmoking Women (2010). Retrieved from: https://www.ncbi.nlm.nih.gov/pubmed/20802022
